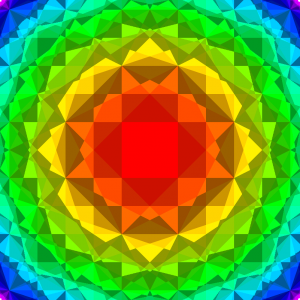
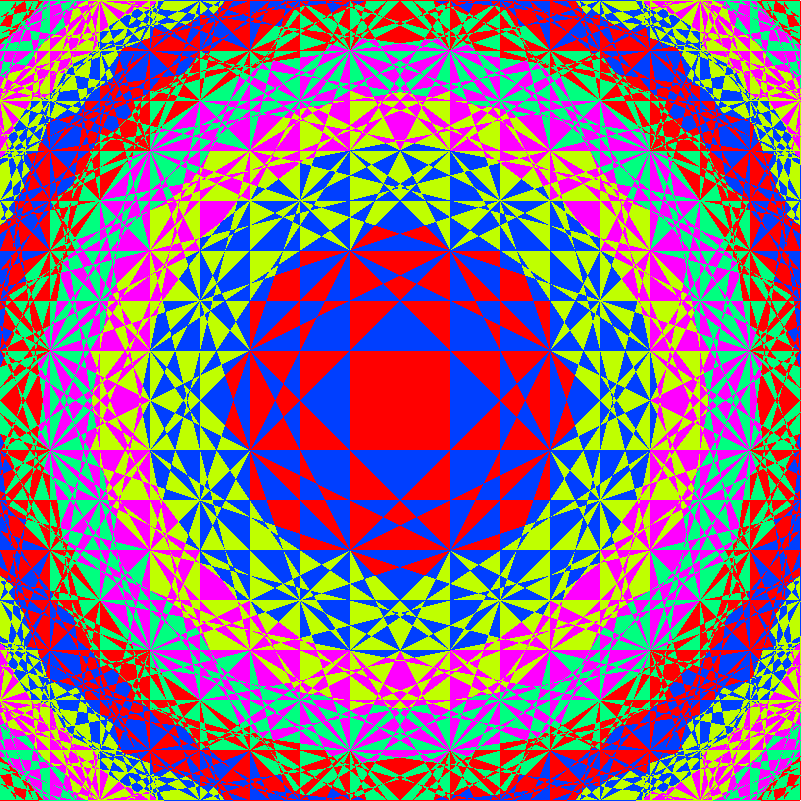
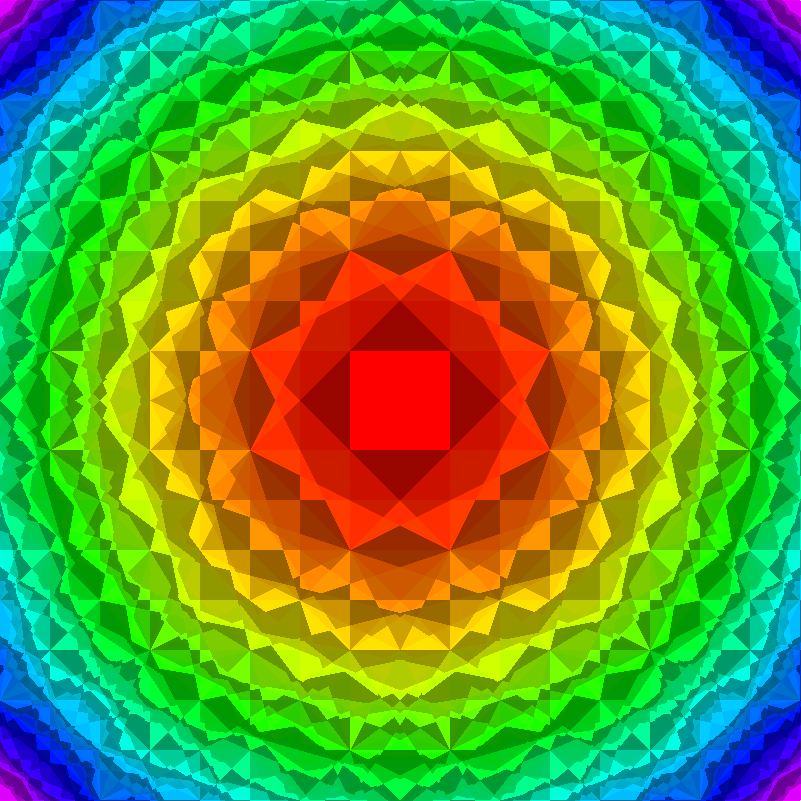
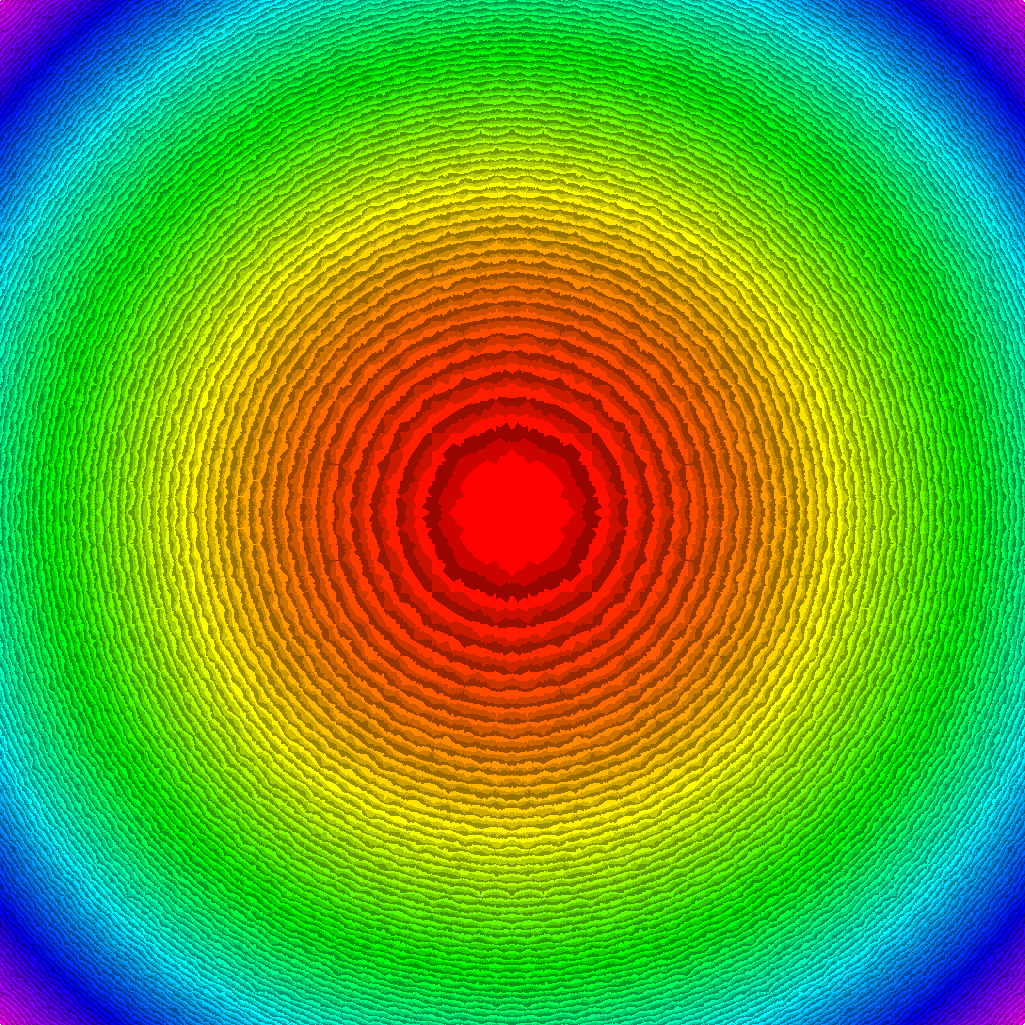
Inspired by a blog post detailing the 27 first brillouin zones I revisited my code for plotting brillouin zones. Here are the first Brillouin zones for 30, 50, 500 and a zillion.
I also plotted a gazillion zones but there is no visible difference from the zillion zones.
Maybe I’ll do the hexagonal next.
Check out the code for the plots at the bottom.
~30 zones

~50 zones
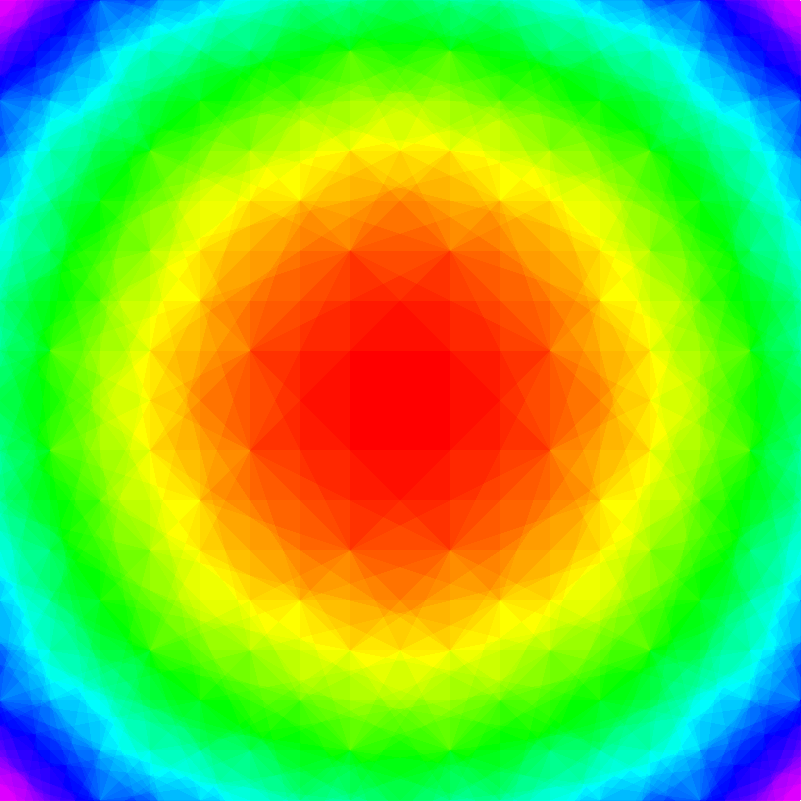
maybe 500 zones
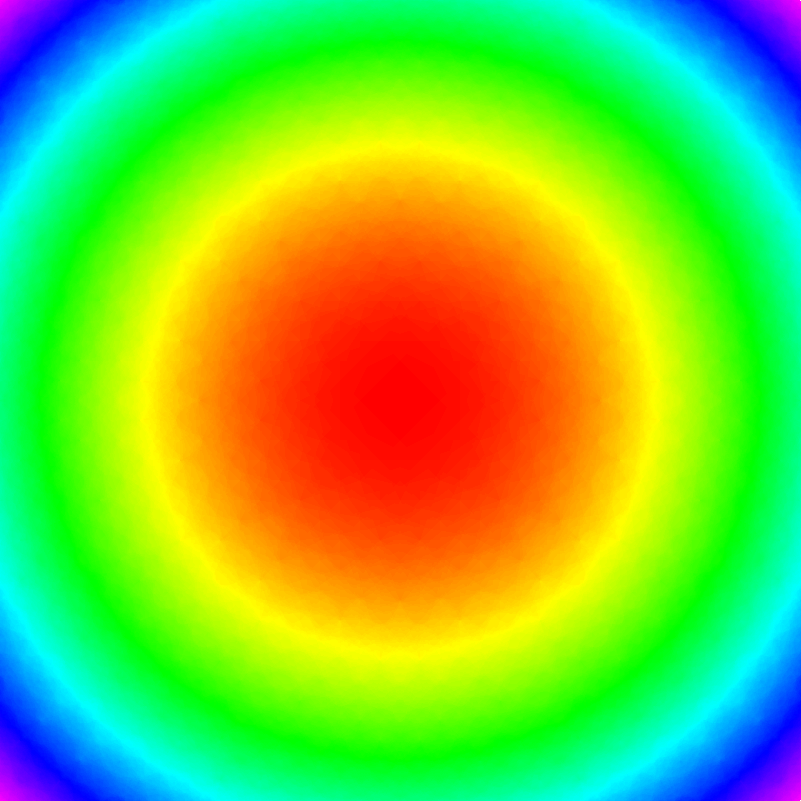
a zillion zones

J code for the plots
N =: 400  NB. plot points NxN(x4 - symmetries)
K =: >:2*N
r =: 40  NB. density. Better be a divisor of N
p =: >.2*(%:2)*N%r NB. lattice points that affect the plot
span =: (0 0) -.~ >,{;/(2,>:2*p) $ r*i:p  NB. (a,b)/(0,0)

fx =: 3 : 0  NB. y=0 point and gradient
  'a b' =. y
  p =. ((b%a)*(-:b)) + -:a
  p, p - ((b%a)*(1-~-:b)) + -:a
)

minz =: 3 :'(a>0) ~: 1 #~ ,.j./"1 (,.(K-])) <.0.5+ ,. |. 0 >. K <. N + (13 :''x + y*i:N'')/fx ''a b'' =. y'
mi0 =: 3 :'(K,K) $!.1 (K*N+>.-:|b=.{:y) # 0'
mi =: minz :: (mi0`(|.@mi0) @. (0>{:))

]M =: +/ mi"1 span

viewmat M NB. or save/whatever.